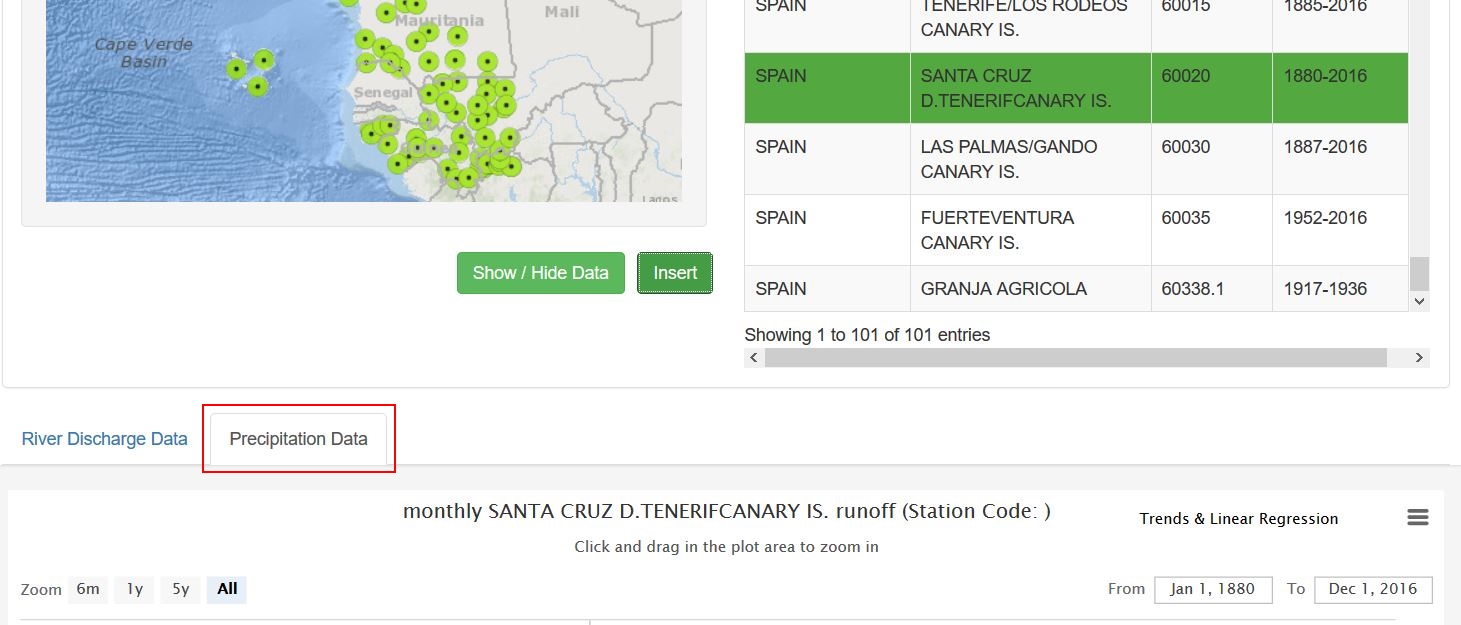
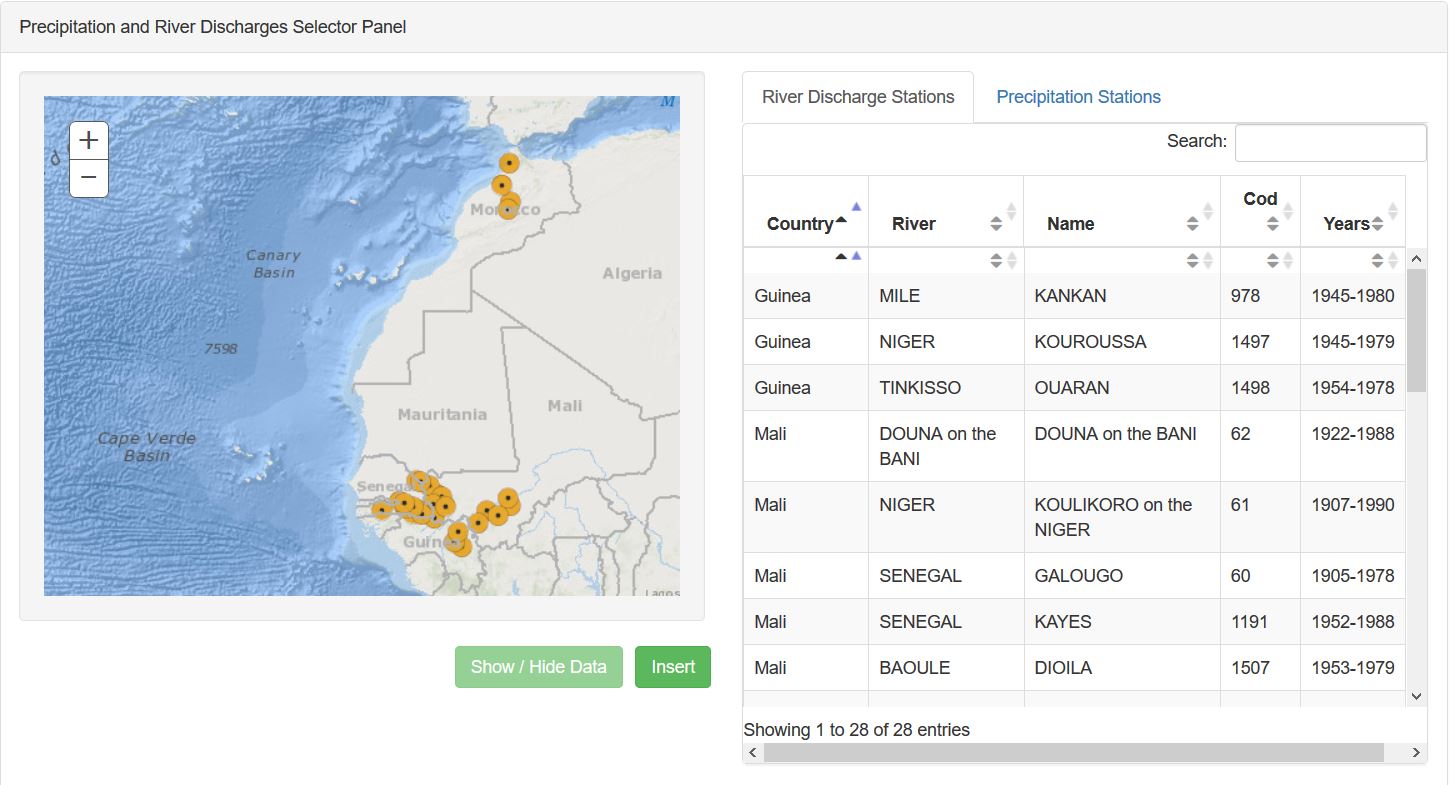
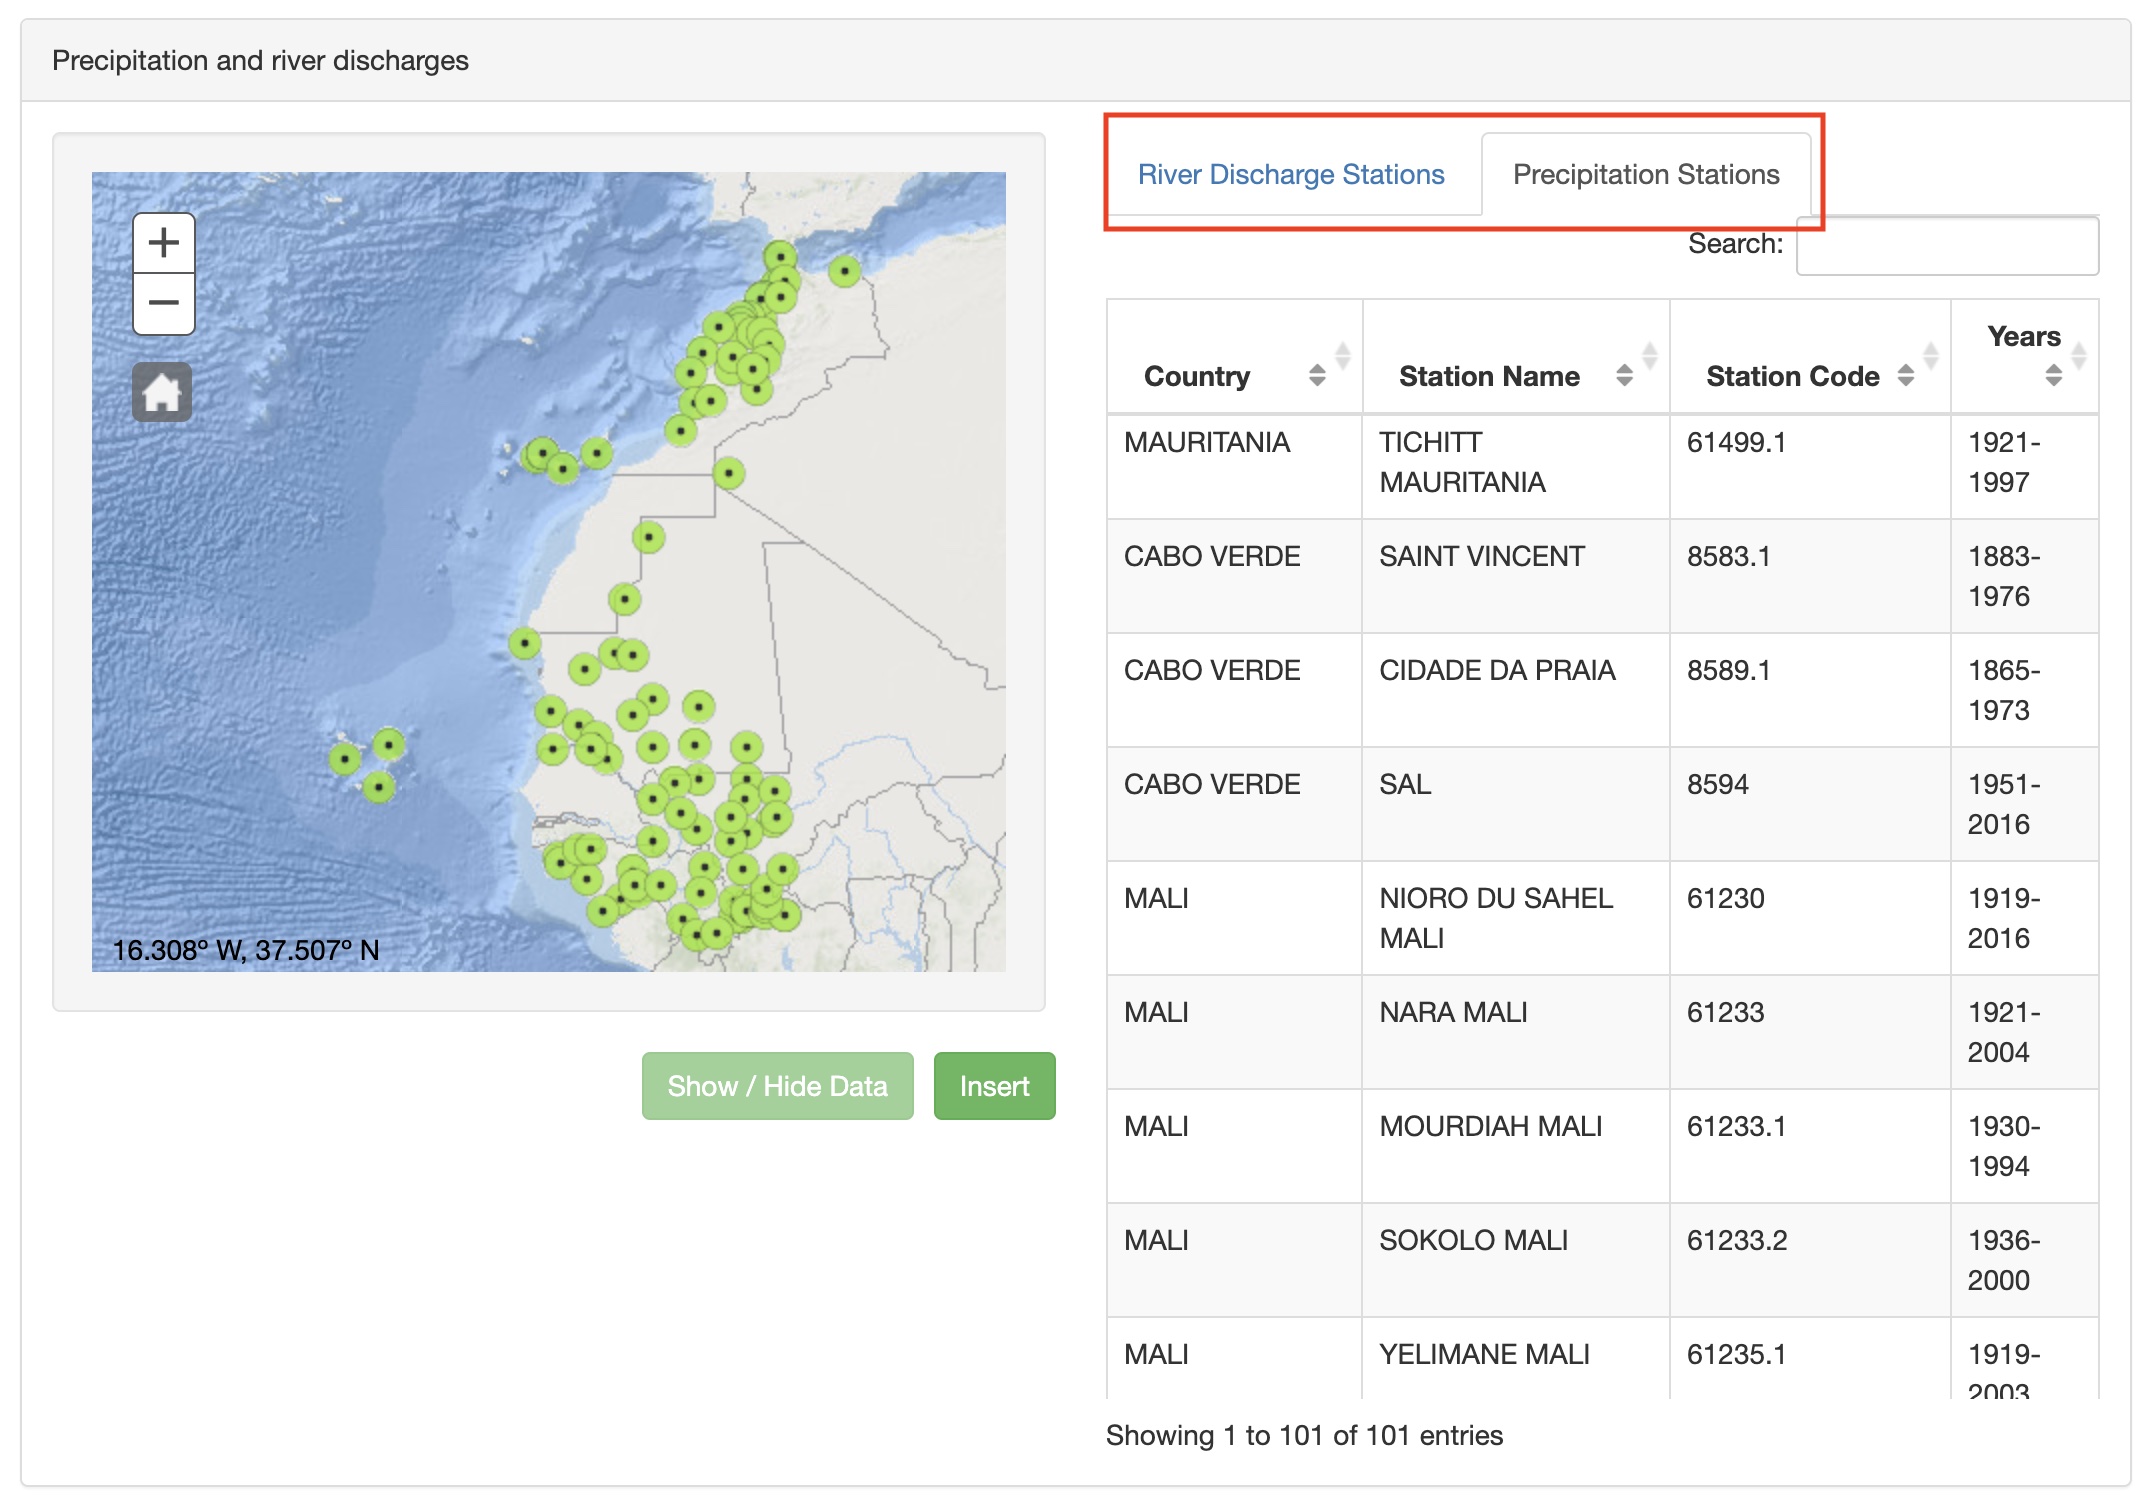
This functionality allows access to the Northwest Africa Rivers Discharge stations stored in the Global River Discharge Database (v1.1) and to the Global Historical Climatology Network-Monthly (GHCN-M), with historical information about precipitation in the region.
All this information is available from the Royal Netherlands Meteorological Institute (KNMI) Climate Explorer web application.
The CCLME ECO-GIS Viewer use the information processed from this web application.
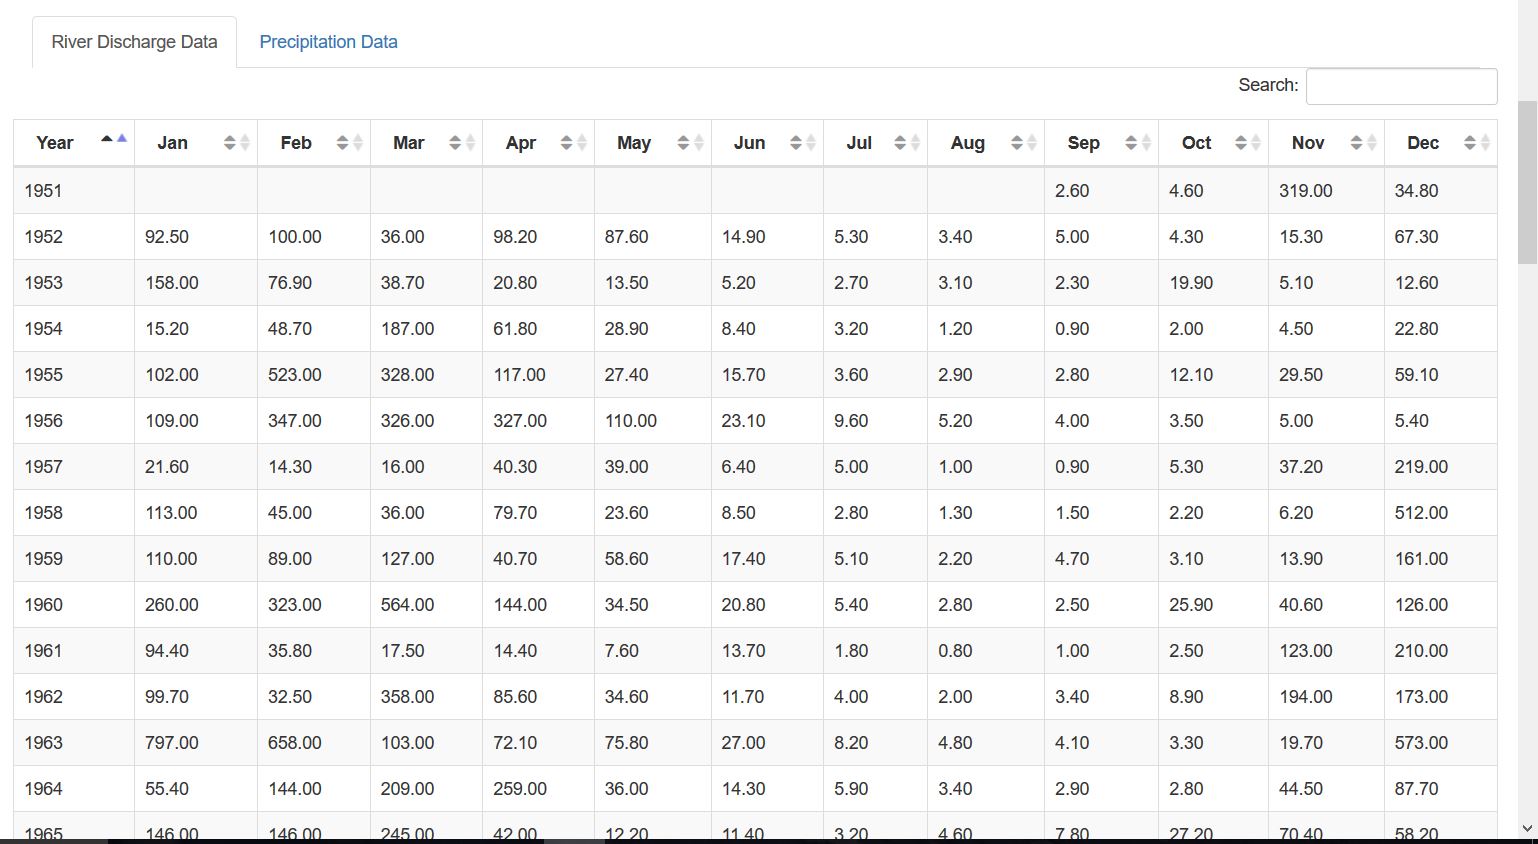
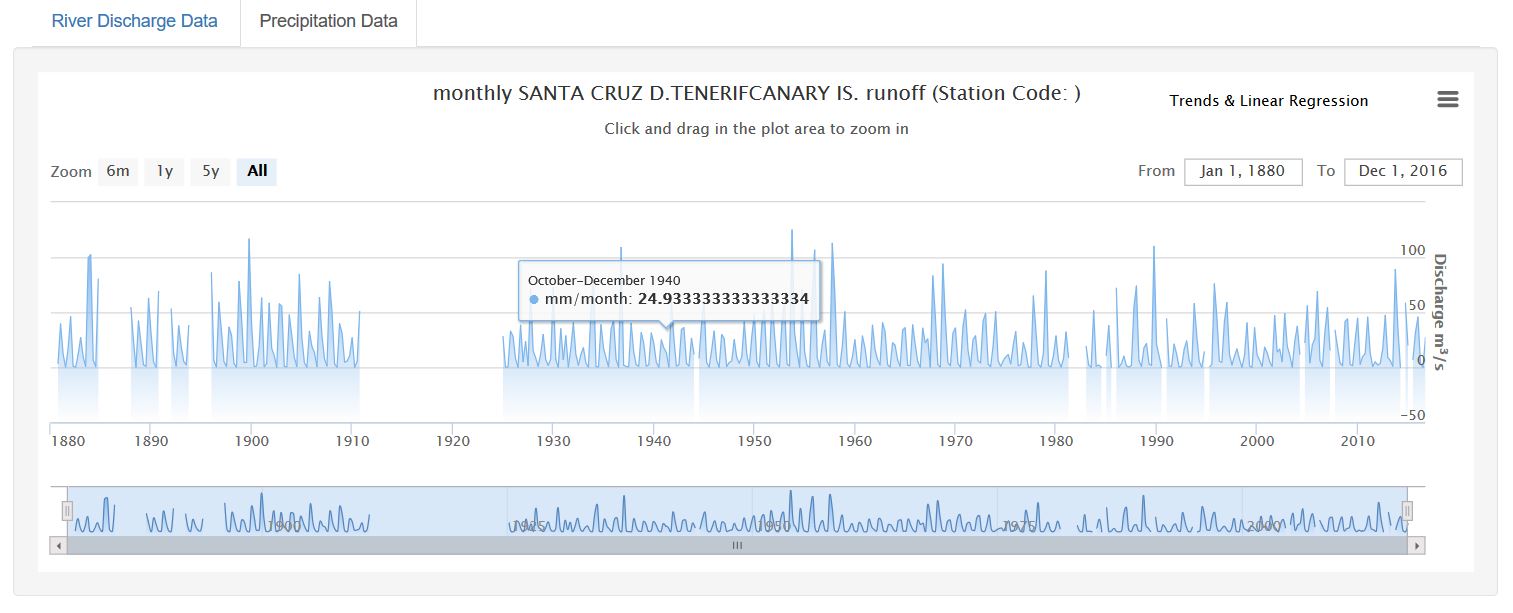
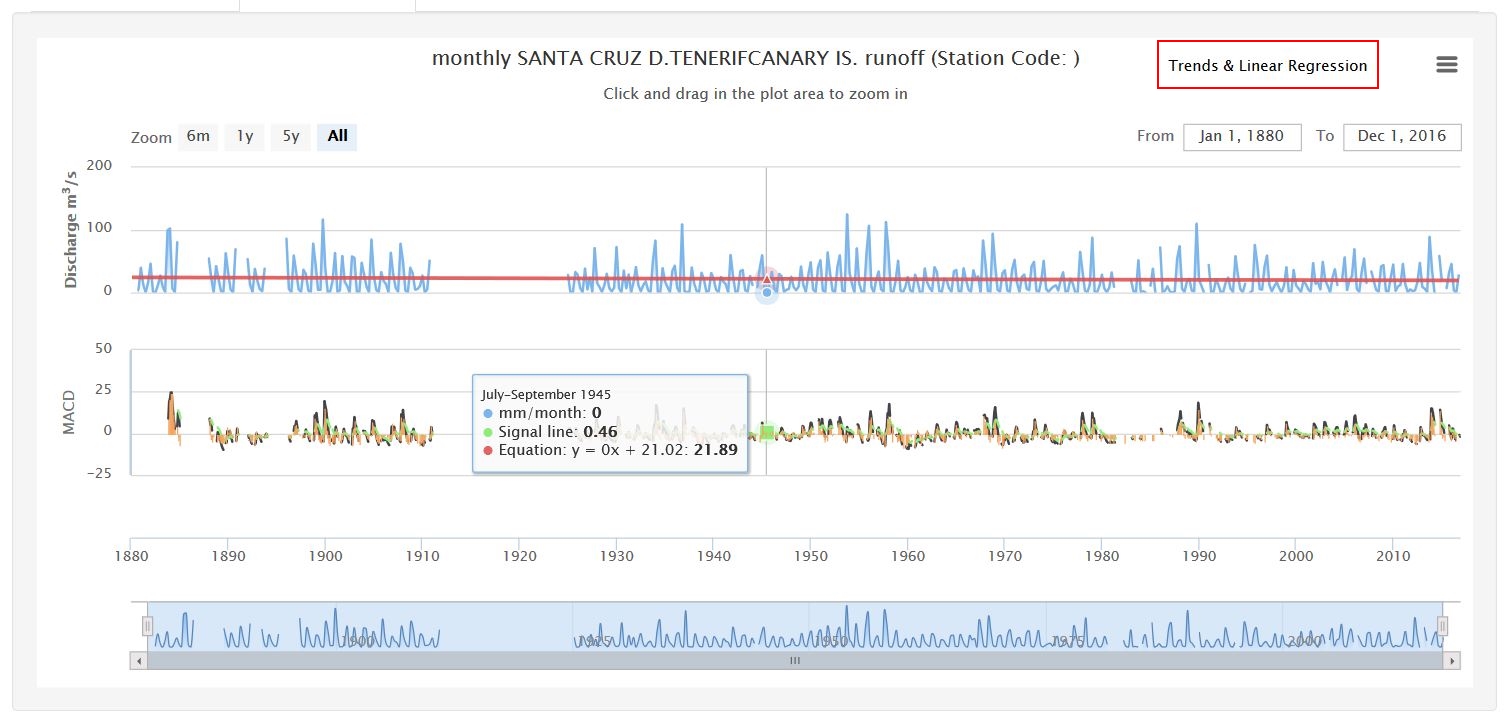
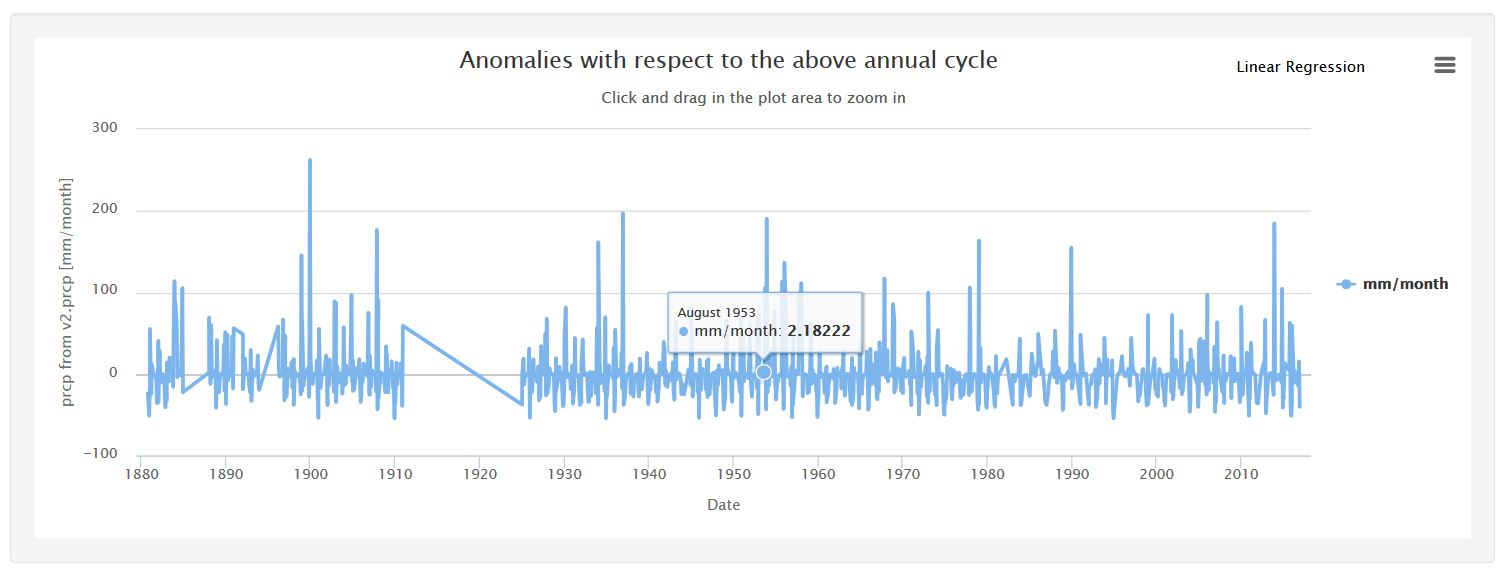
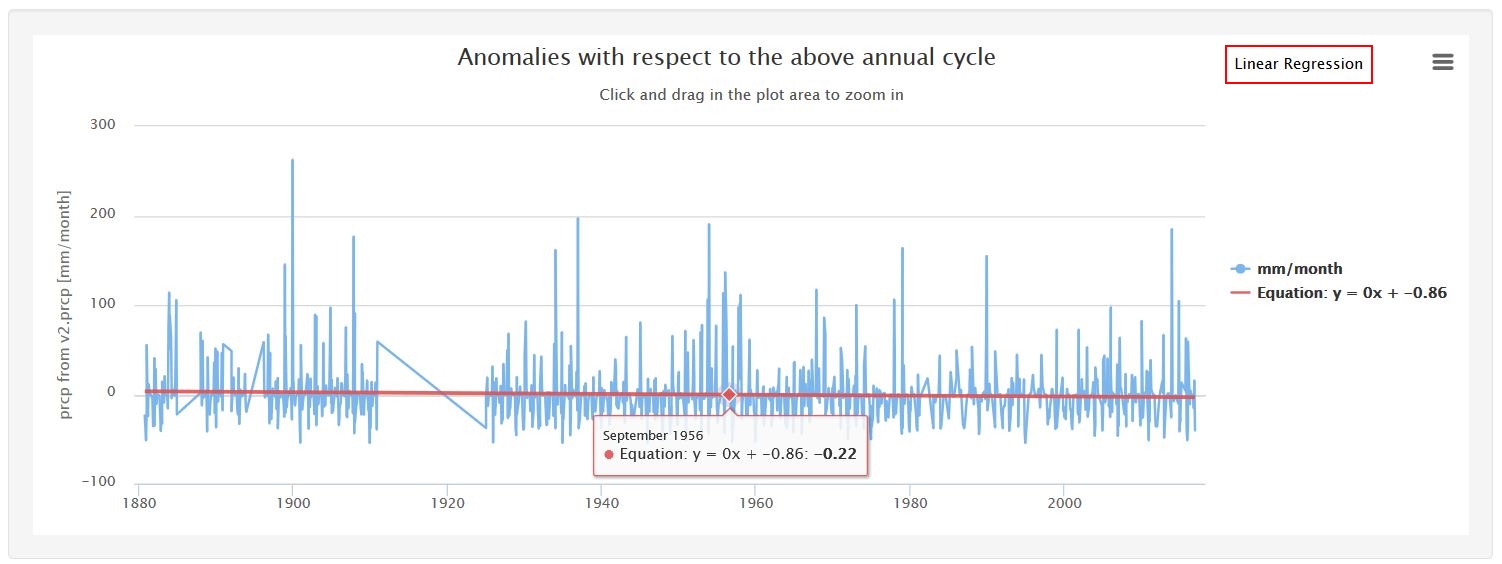
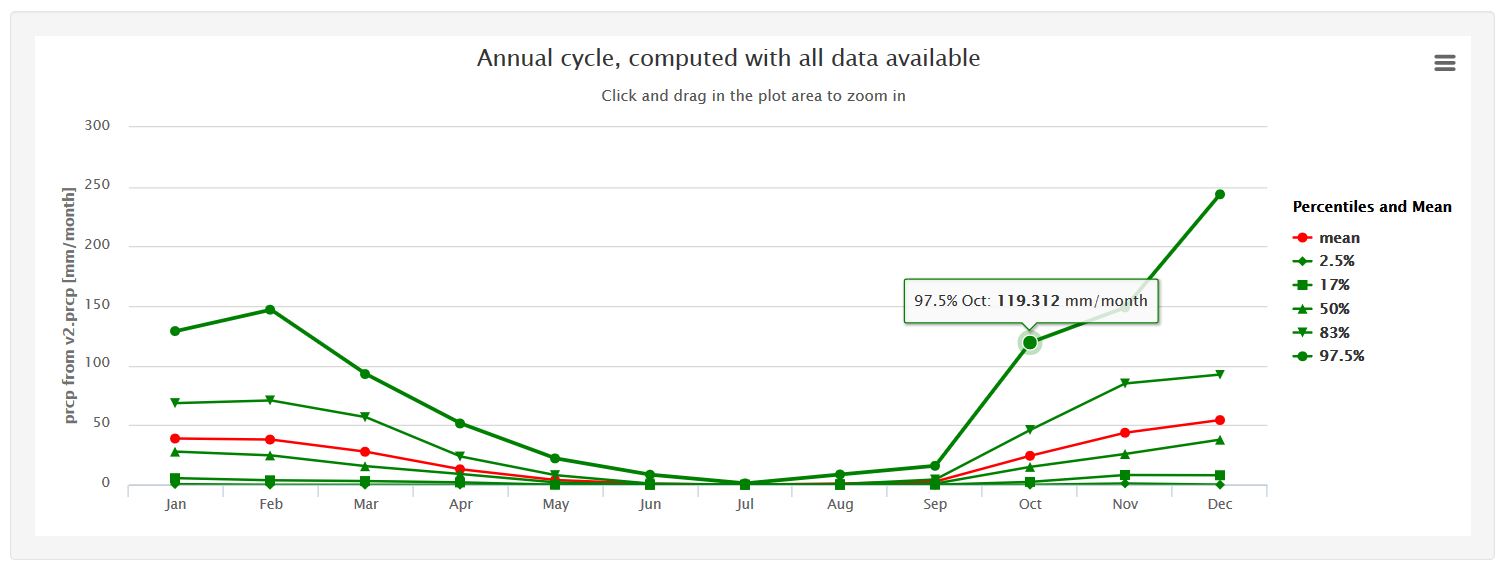
With all the information stored in the stations selected by the user several graphs are displayed.
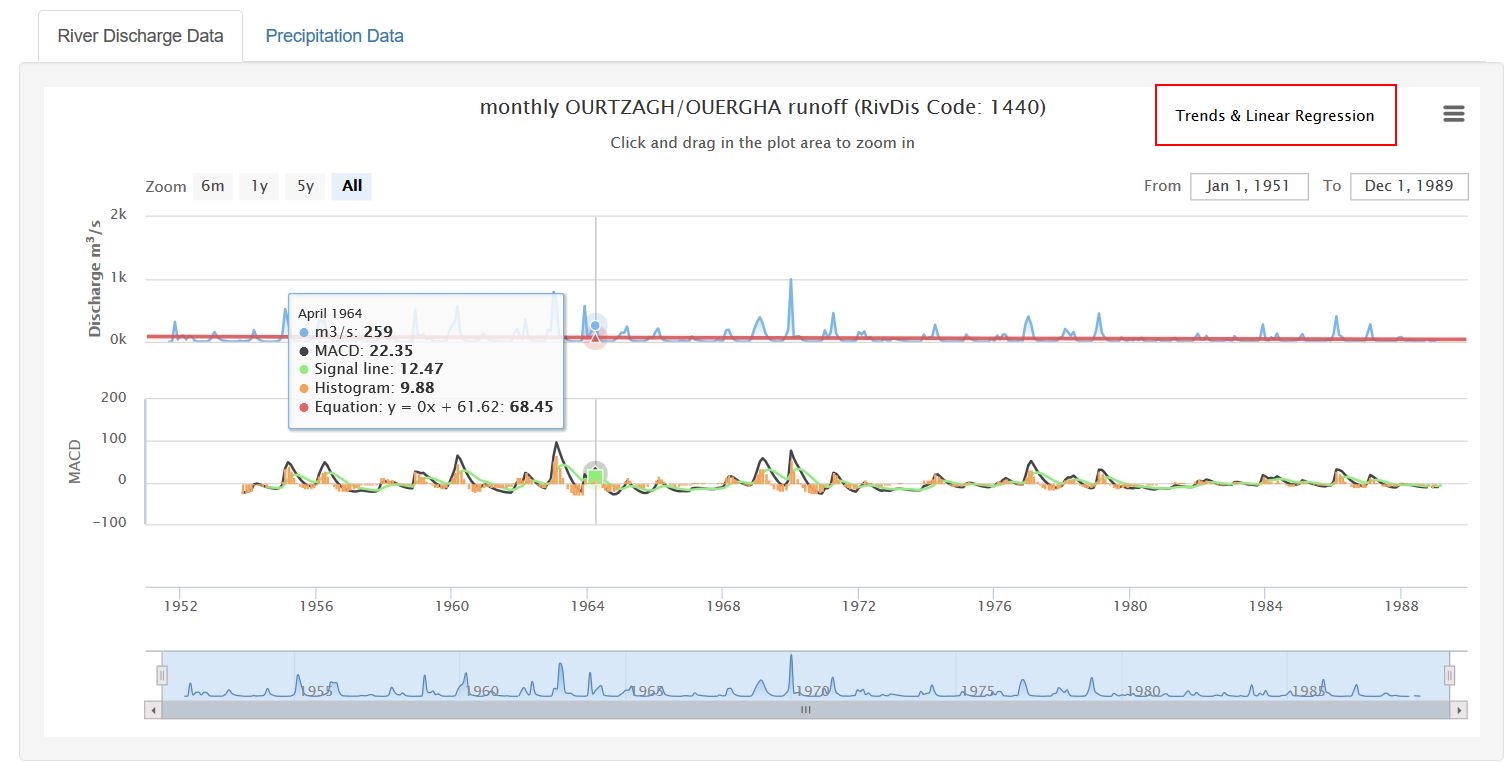
• Global River Discharge Database (v1.1): he Global River Discharge Database development efforts represent the first step in a continually evolving compilation of river discharge information. One of the primary sources of information for the database development was the UNESCO river archives and the series of publications entitled "The Discharge of Selected Rivers of the World" which were provided, in book form, from 1969 to 1984. The series served as an important source of information on approximately 1000 stations. RivDis v1.0 provides discharge data from the original UNESCO publication series in a digital format that can be easily acquired and analysed by researchers and planners in the water sciences community. The contents of RivDis v1.0 were published recently in book form (Vorosmarty et al. 1996a) and can be obtained from UNESCO's International Hydrological Programme Headquarters (Offices: 1, Rue Miollis /75732 Paris CEDEX 15). This has resulted in the development of a database we refer to as RivDIS v1.0 and full publication summarizing the database.
References:
Vörösmarty, C.J., B. Fekete, and B.A. Tucker. 1998. River Discharge Database, Version 1.1 (RivDIS v1.0 supplement). Available through the Institute for the Study of Earth, Oceans, and Space / University of New Hampshire, Durham NH (USA).
Vörösmarty, C.J., B. Fekete, and B.A. Tucker. 1996. River Discharge Database, Version 1.0 (RivDIS v1.0), Volumes 0 through 6. A contribution to IHP-V Theme 1. Technical Documents in Hydrology Series. UNESCO, Paris.
• Global Historical Climatology Network-Monthly (GHCN-M): The GHCN monthly climate dataset coms from the National Oceanic and Atmospheric Administration/ National Climatic Data Centre (NOAA/NCDC). In late 2008, it contained 20,586 precipitation stations, 7,279 mean temperature stations, 4,965 minimum/maximum temperature stations and 2667 pressure stations, varying in length from hundreds of years to just a few.
The data comes in two forms, adjusted and unadjusted. The first set has been corrected for urban effects and the second biases by comparing urban stations to nearby rural stations. The adjusted data are only available for a few countries.
The KNMI Climate Explorer has post-processed the NCDC data by combining all time series for a given station. At the momen this is done very crudely. For each year, the first series with valid data is chosen. I plan to merge these series more intelligently, using all data and taking into account the possibility of biases.
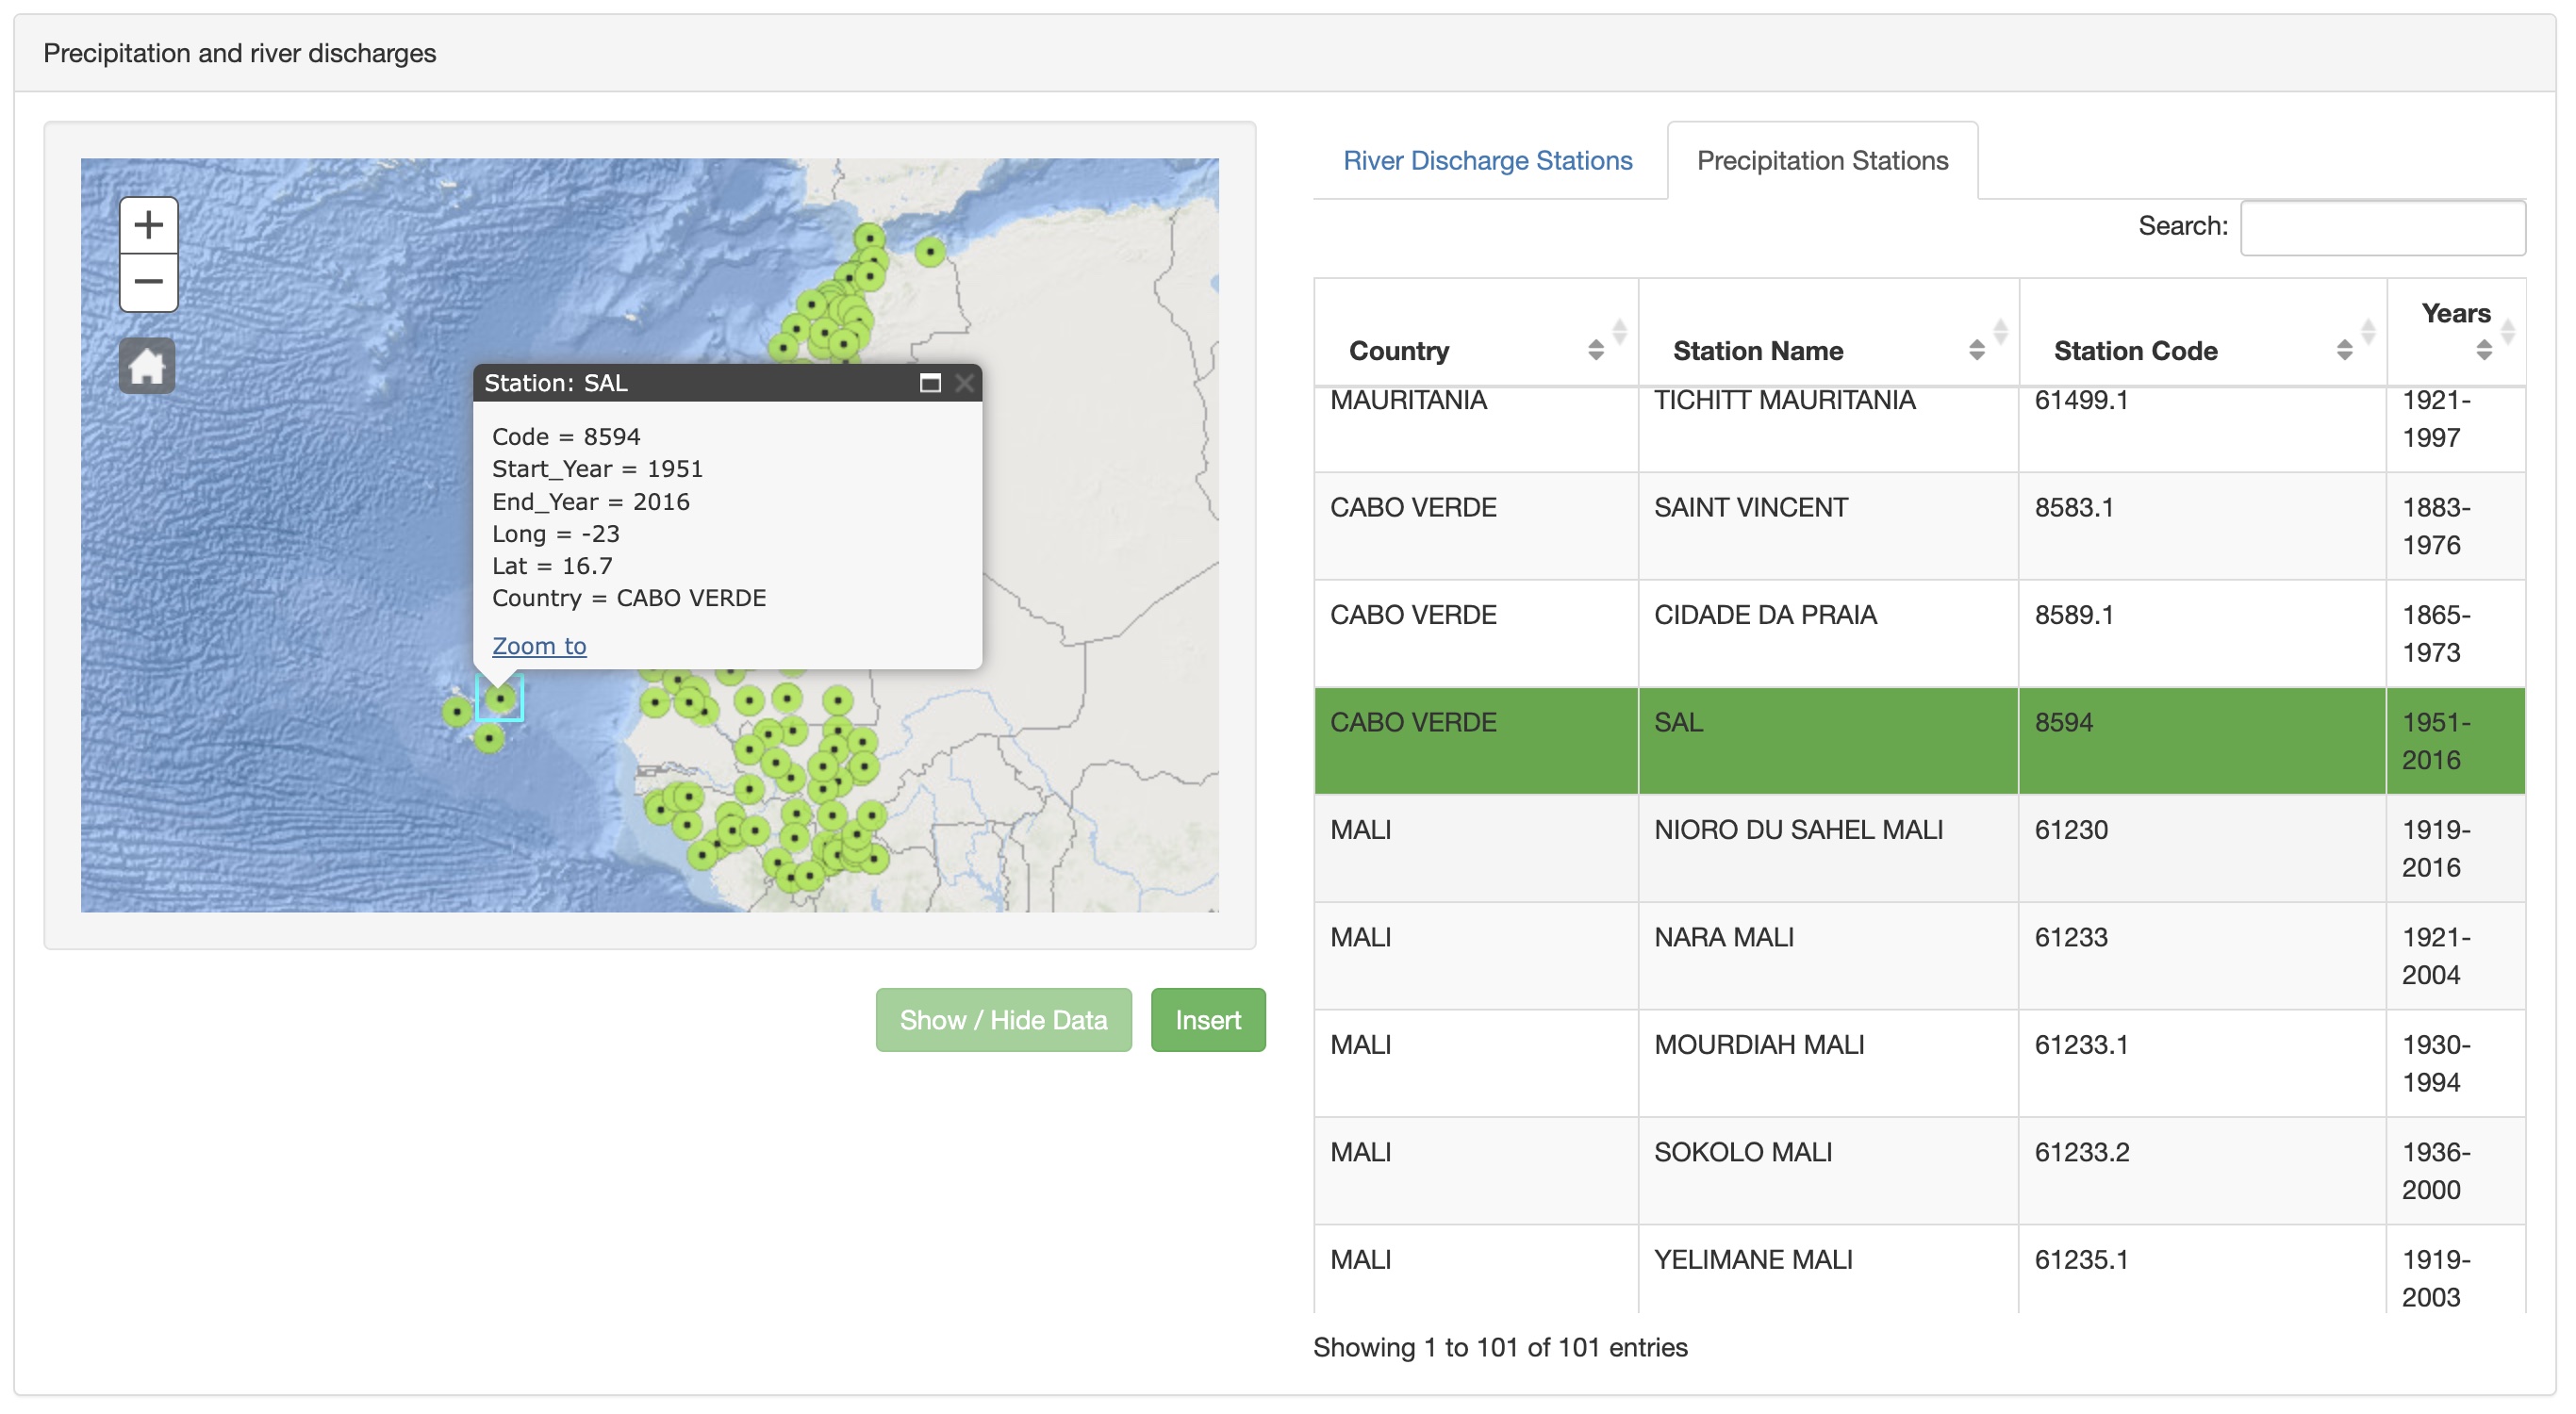
The quality of the data varies. Most problematic are very old data, before observations were standardized enough (1855, 1905, 1950 are common discontinuities), and very new data from the Global Telecommunication System (GTS). Most errors have been removed by the quality control system at NCDC, but inevitably some remain. It always pays to have a glance at the time series. It may also be worth checking whether the coordinates match with those expected, e.g., in Google Earth - some stations are mislocated. Please report errors back to me and NCDC.
The database is updated from NCDC into the Climate Explorer once every month.
References:
Peterson, Thomas C. and Russell S. Vose, 1997: An Overview of the Global Historical Climatology Network Temperature Data Base, Bulletin of the American Meteorological Society, 78, 2837–2849.
• KNMI Climate Explorer web application: The KNMI Climate Explorer is a web application used to analyse climate data statistically, developed by Geert Jan van Oldenborgh. It started in late 1999 as a simple web page to analyse ENSO teleconnections and has grown over the years to more than one terabyte (TB) of climate data and dozens of analysis tools. It is now part of the World Meteorological Organization (WMO) Regional Climate Centre at KNMI, together with the European Climate Assessment and Dataset (ECA&D).

 button.
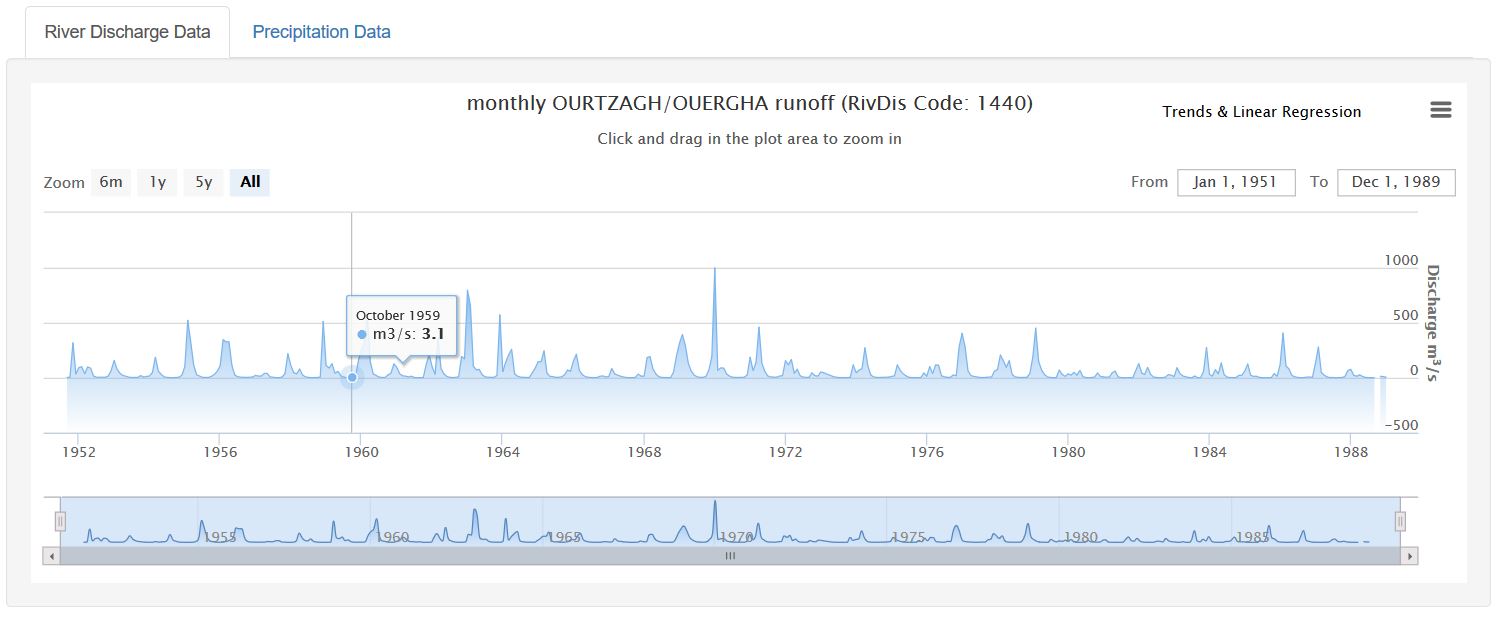
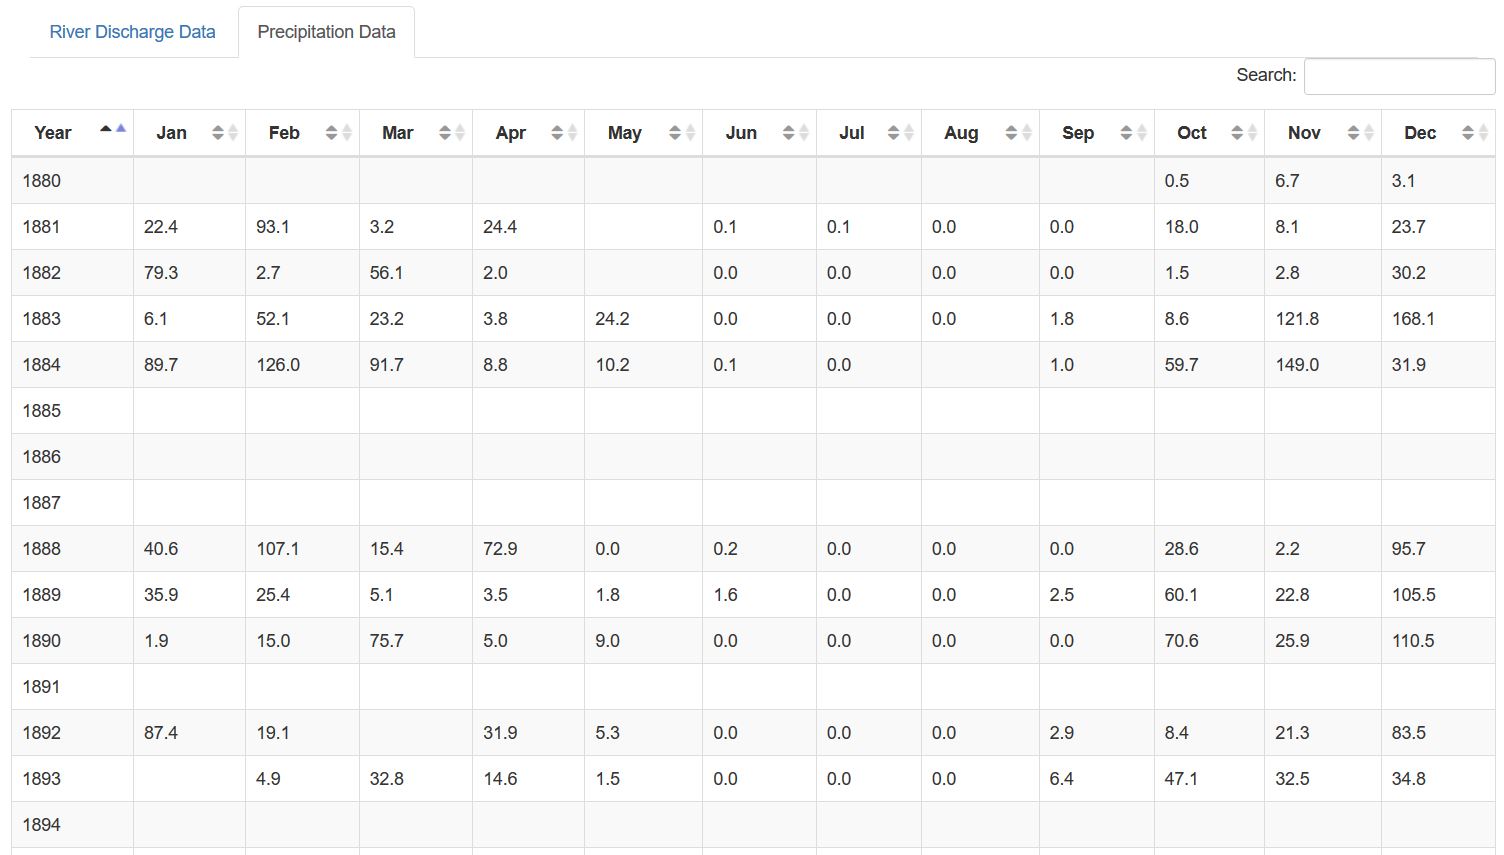
 and when clicked, a table with the raw data is shown.