By accessing this tool, the map region shows the Select Action panel. From this panel the user can work
with the tools.
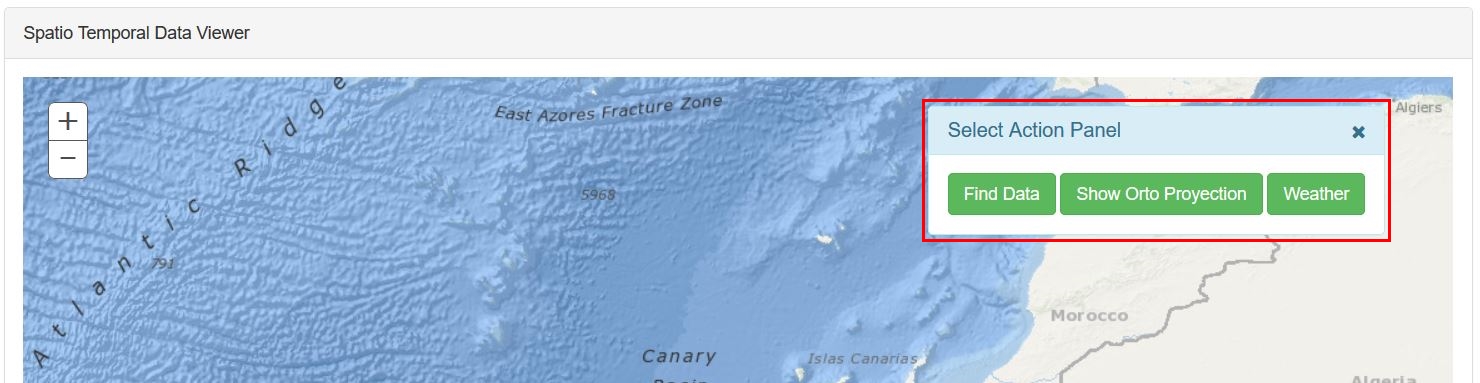
• Find Data: Clicking on the "Find Data" button
 , gives accesses the "Find panel", from which the user can access samples with oceanographic information.
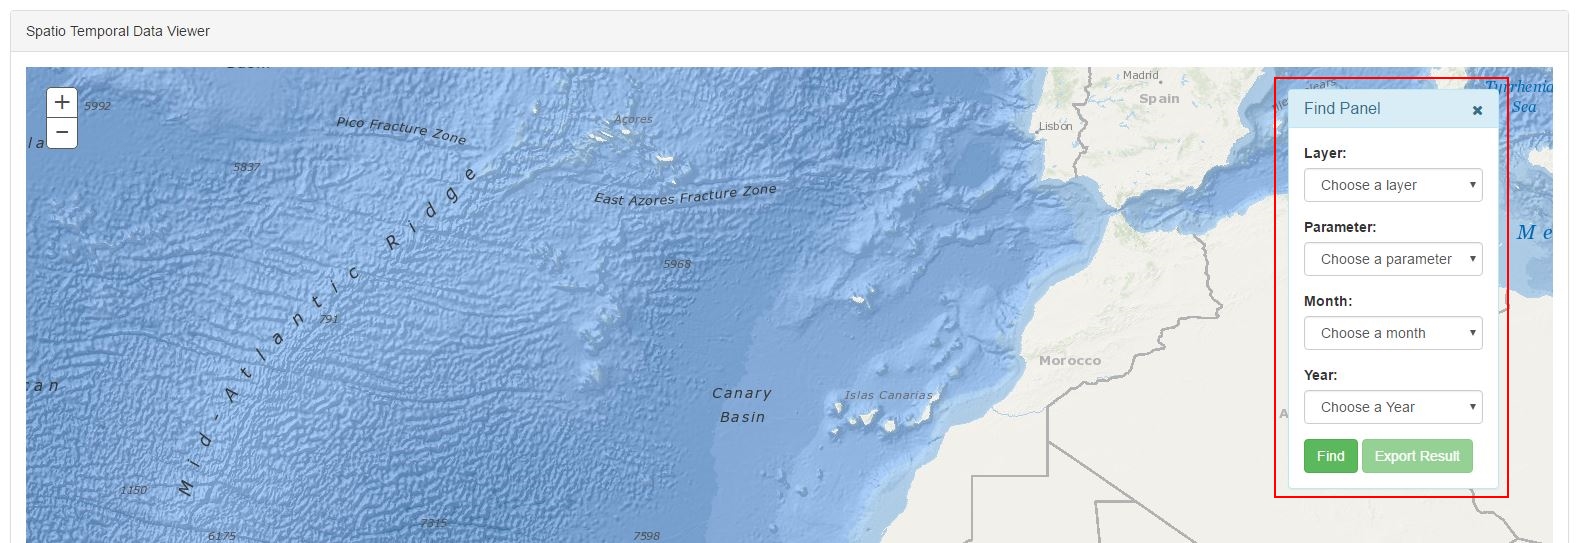
From the "Layer" selector it is possible to choose the kind of sample instrument (CTD, Primary Production).
CTD is an acronym for Conductivity, Temperature, and Depth and is the primary tool for determining essential physical properties of sea water.
If CTD is selected, in the Parameter selector the oceanographic parameter is selected (Temperature, Salinity, Oxygen, Chlorophyll),
depending of the selected value in the "Layer" selector the user can access determinate parameters. In the
"Month" selector, the month in which the sample was collected can be selected. The "Year" selector determines
the year of sampling.
The "Find" button loads the information of the samples filtered by the parameters selected by the user, in the map,
and centre and zoom the map over the result. Hovering on an entity displays a popup with metadata of the sample and the information for the different depth levels.
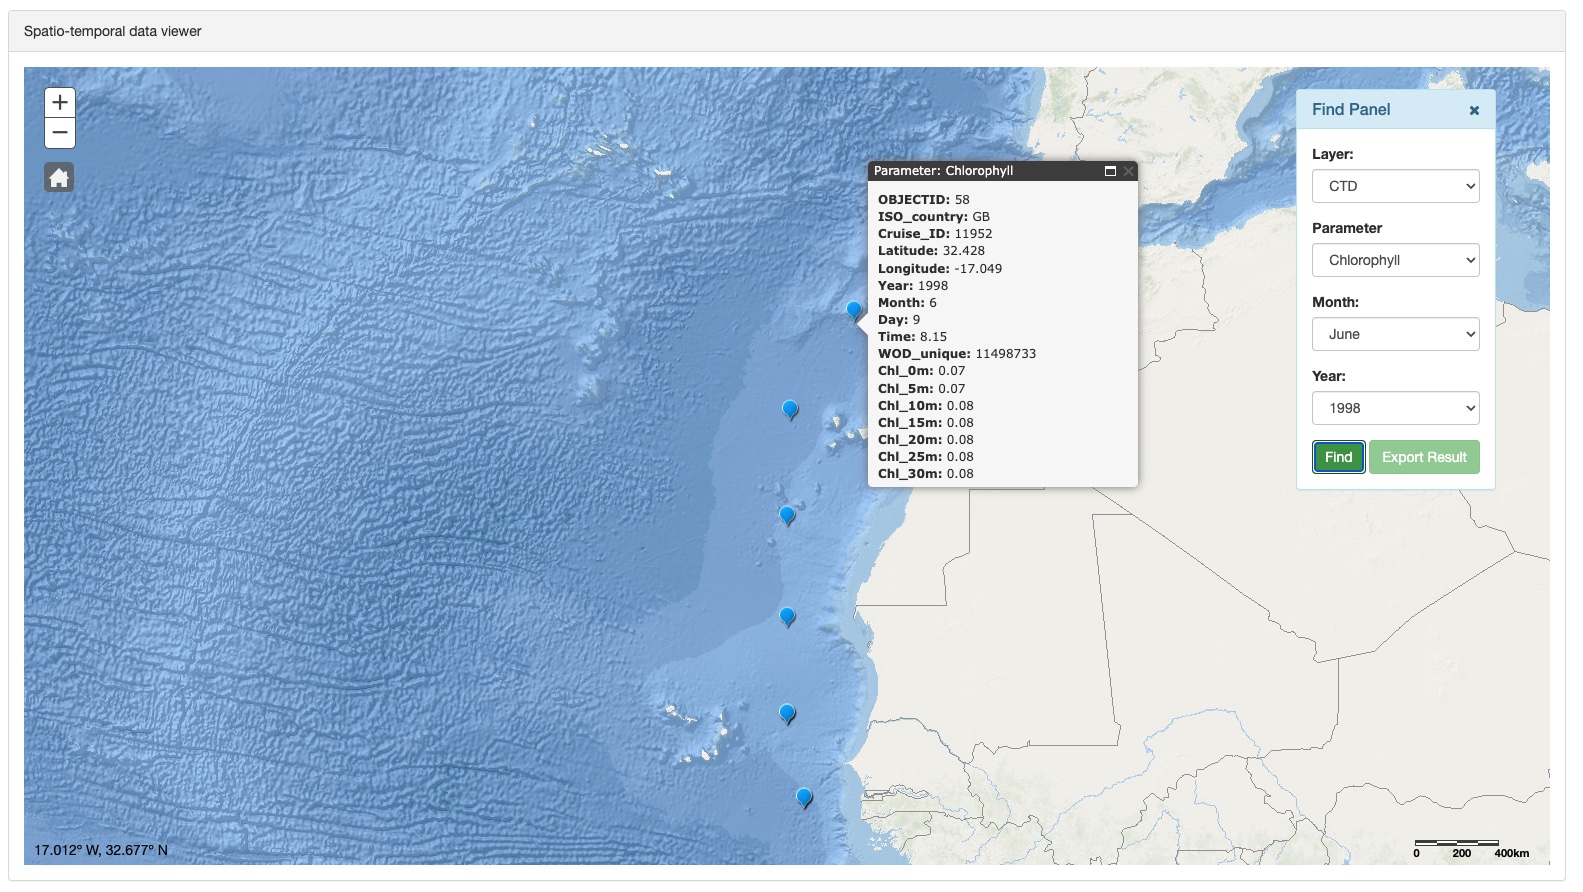
From the "Find Data" the Primary Production database is also accessed with various filter options.
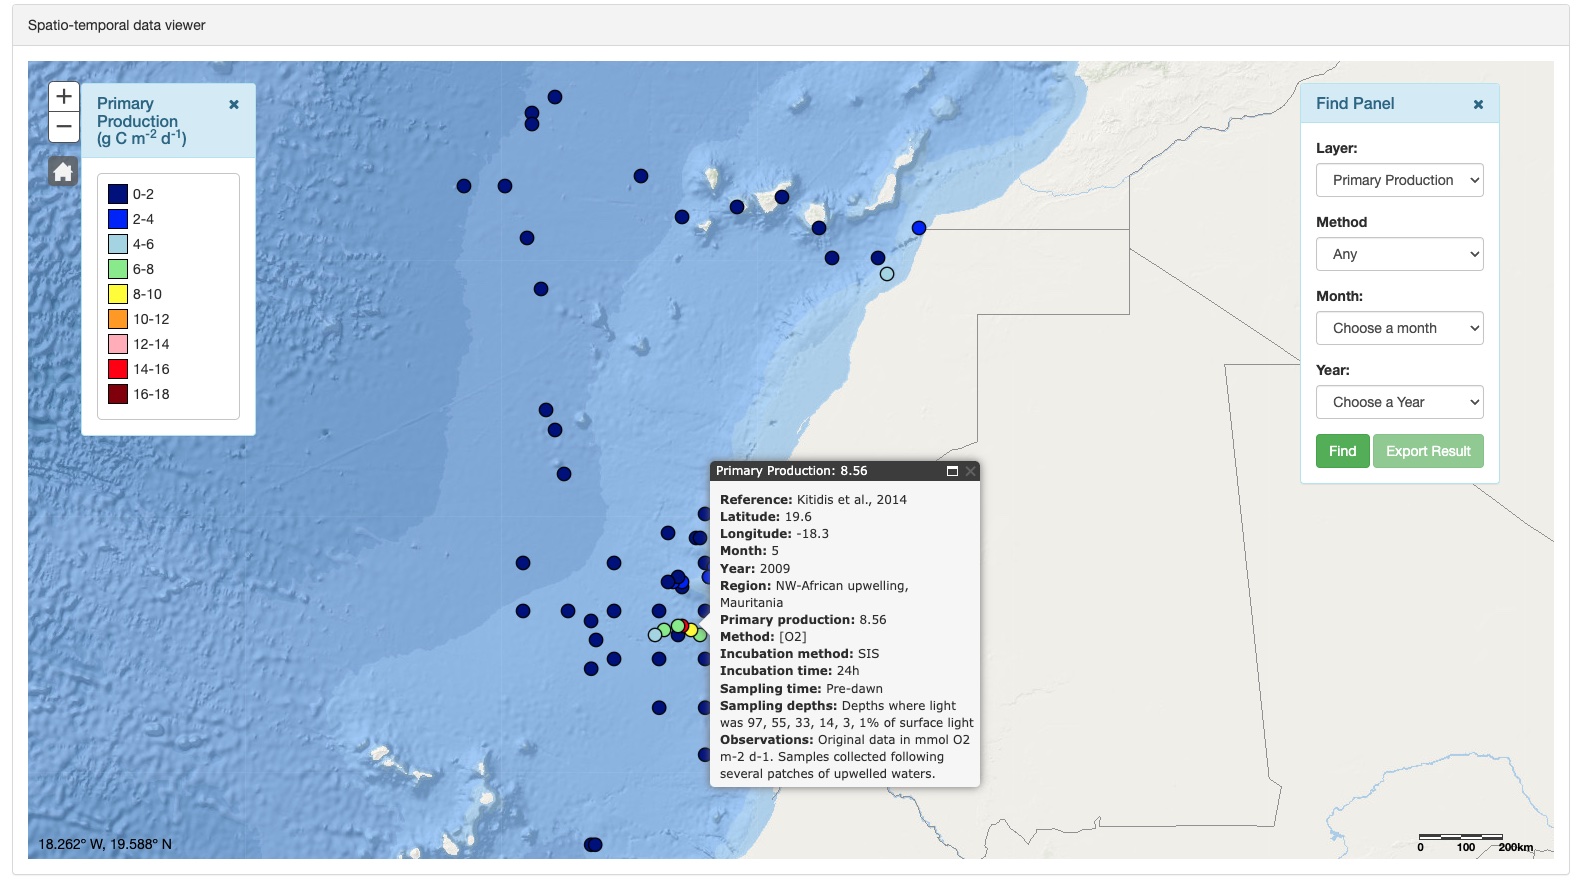
In addition, the user can download the information of all the samples resulting from the searches, in different
formats (shp, gdb, dxf) with the "Export Result" Button.
• Show Orthographic Projection: Click on the "Show Orthographic Projection"
button, to access the "Show Ortho Projection" panel, a tool that allows the user to handle the Earth viewer from the
CCLME GIS Viewer and gain access to all its information.
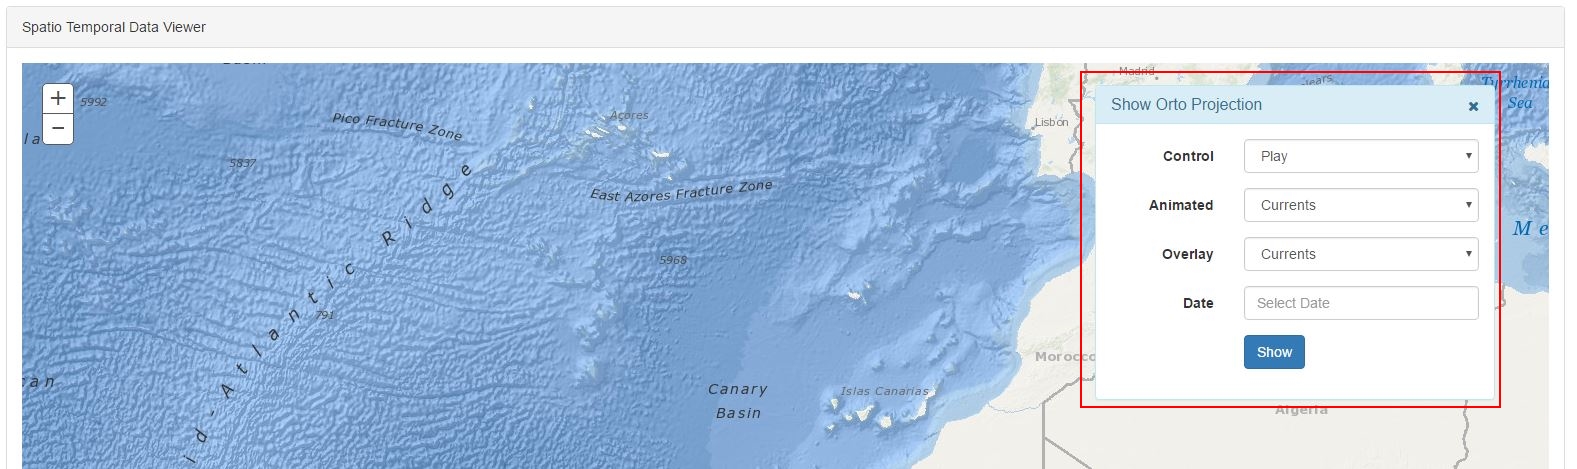
• Control Selector: This function allows to activate and deactivate the animations.
• Animated Selector: The user can select between "show currents" or "show waves" in the animations.
• Overlay Selector: From this selector the user can choose the next raster layer to load in the viewer:
- Sea Surface Temperature (SST):

- Sea Surface Temperature Anomaly (SSTA):

- Current:

- Waves:

- Significant Wave Height (HTSGW):

- None
• Date: Select the date of the information to be shown. If the date is not selected, the current information is
displayed by default.
Further information about the data may be found on the web page of the Earth viewer.
Clicking on the "Show" button displays a panel showing a viewer, centred in the CCLME region, with the
information and animation selected by the user.
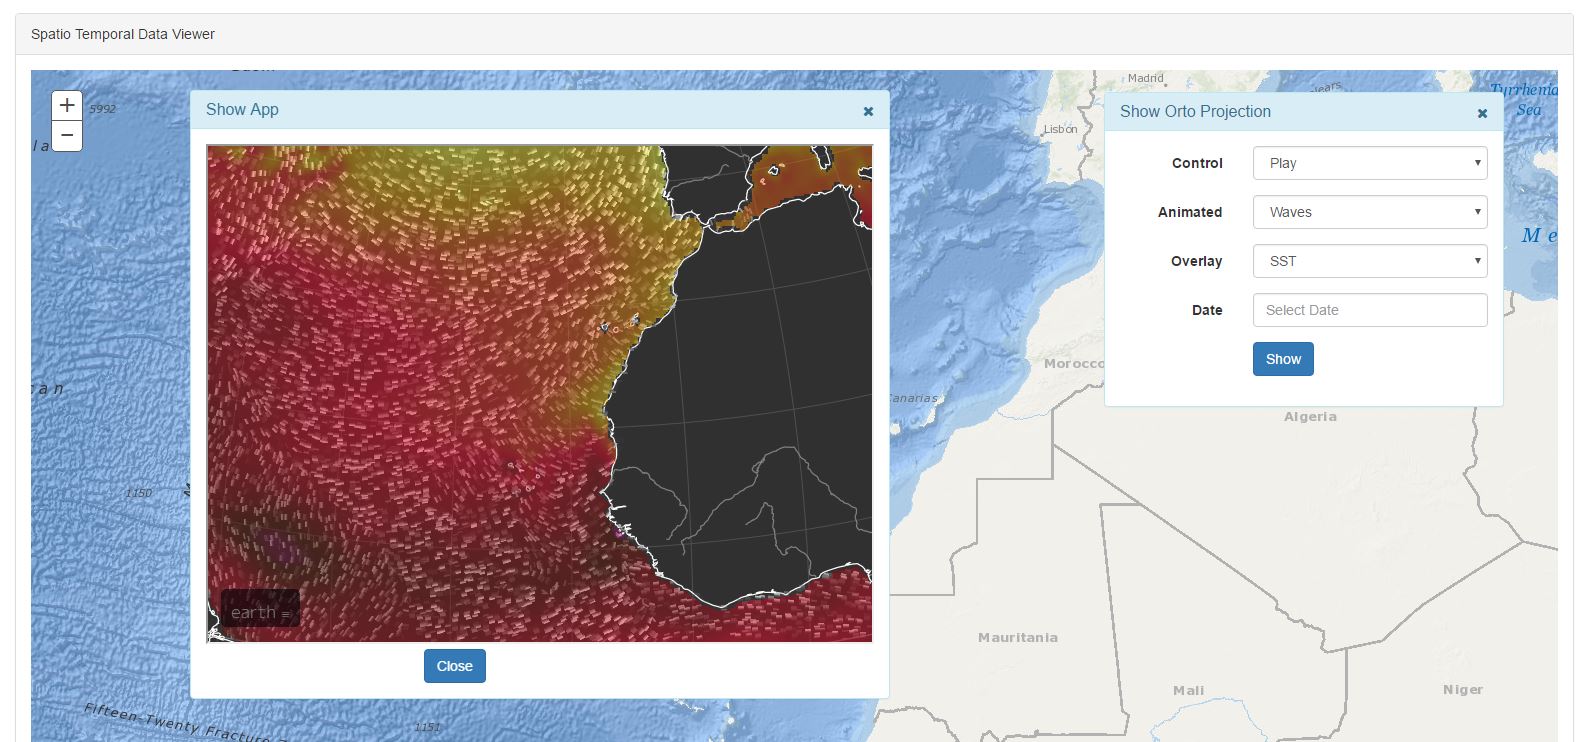
When the user left clicks with the mouse on the viewer, information is shown on the pixel for this point and its
position. The following image display the SST value for the position selected by the user.
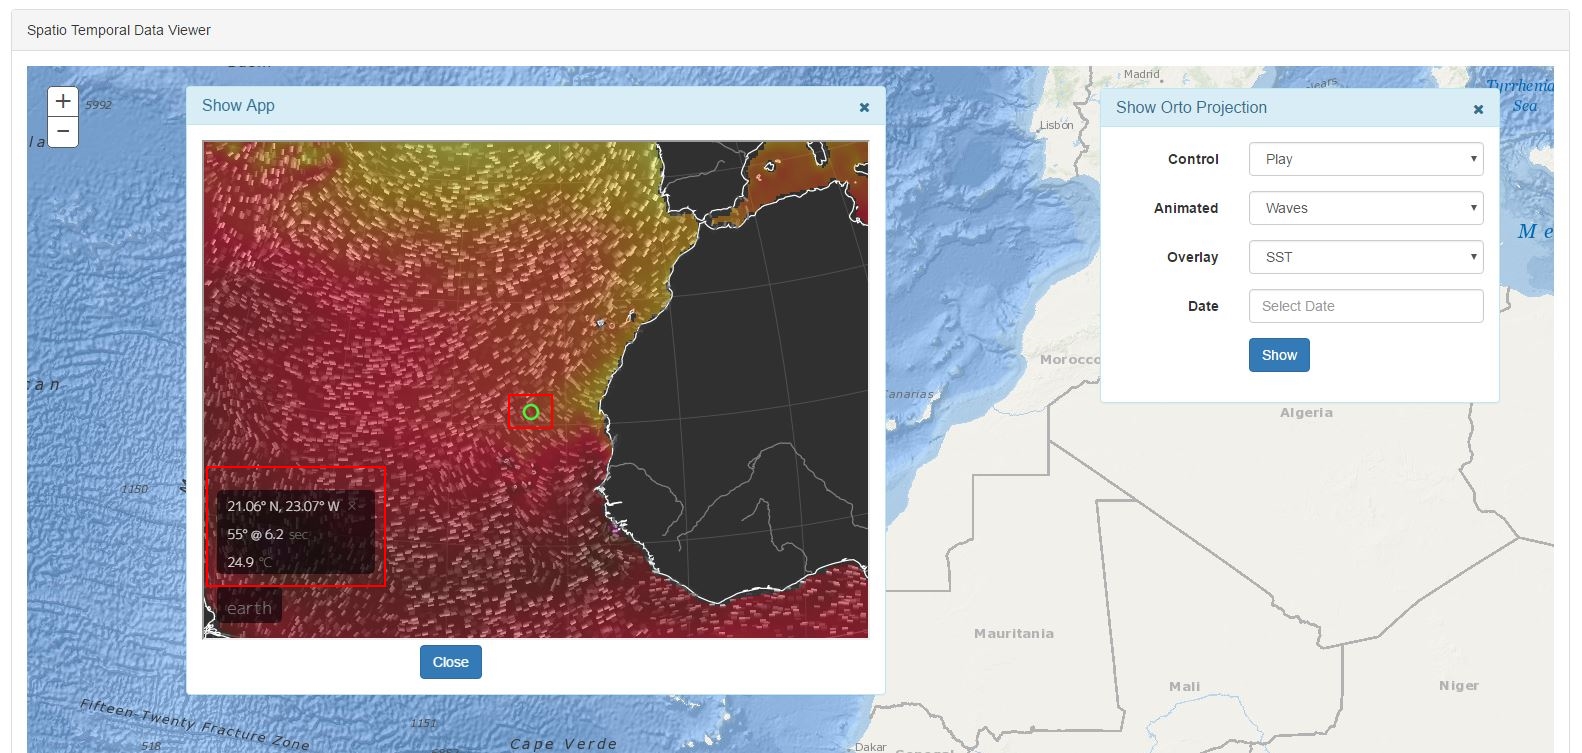
At any moment, the user can change his/her preferences and redraw the information loaded in the viewer.
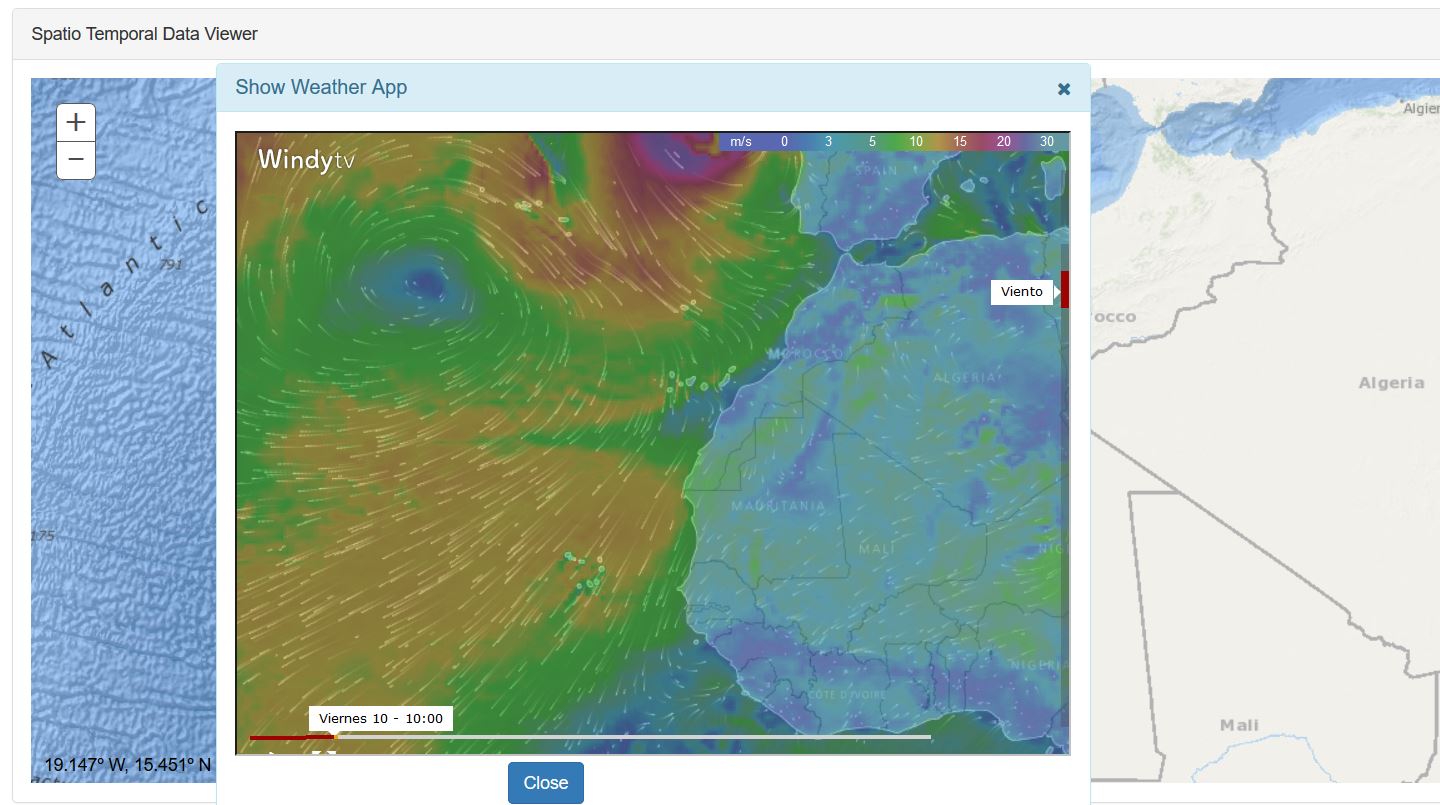
• Weather: Clicking the "Weather" button
 gives access to the "Weather" panel, which is the tool that opens the Windytv viewer from the CCLME GIS Viewer
and provides access to all its information centred in the CCLME region.
gives access to the "Weather" panel, which is the tool that opens the Windytv viewer from the CCLME GIS Viewer
and provides access to all its information centred in the CCLME region.
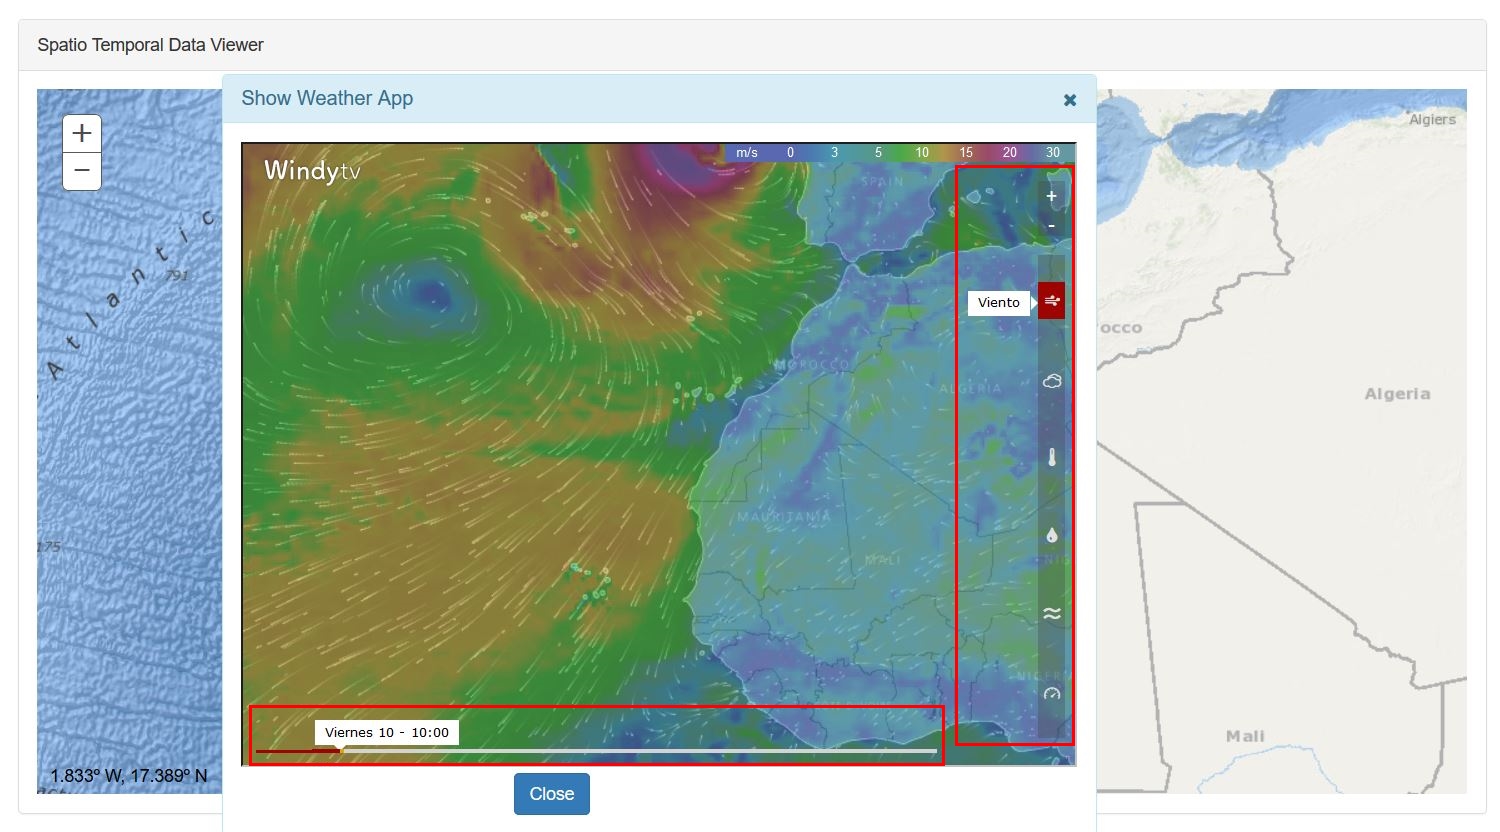
On the right side is a toolbar that enables the user to change the layer type to find information about wind,
clouds, temperature, rain, waves and pressure). The bottom slider allows the user to change the date of data
shown in the viewer.
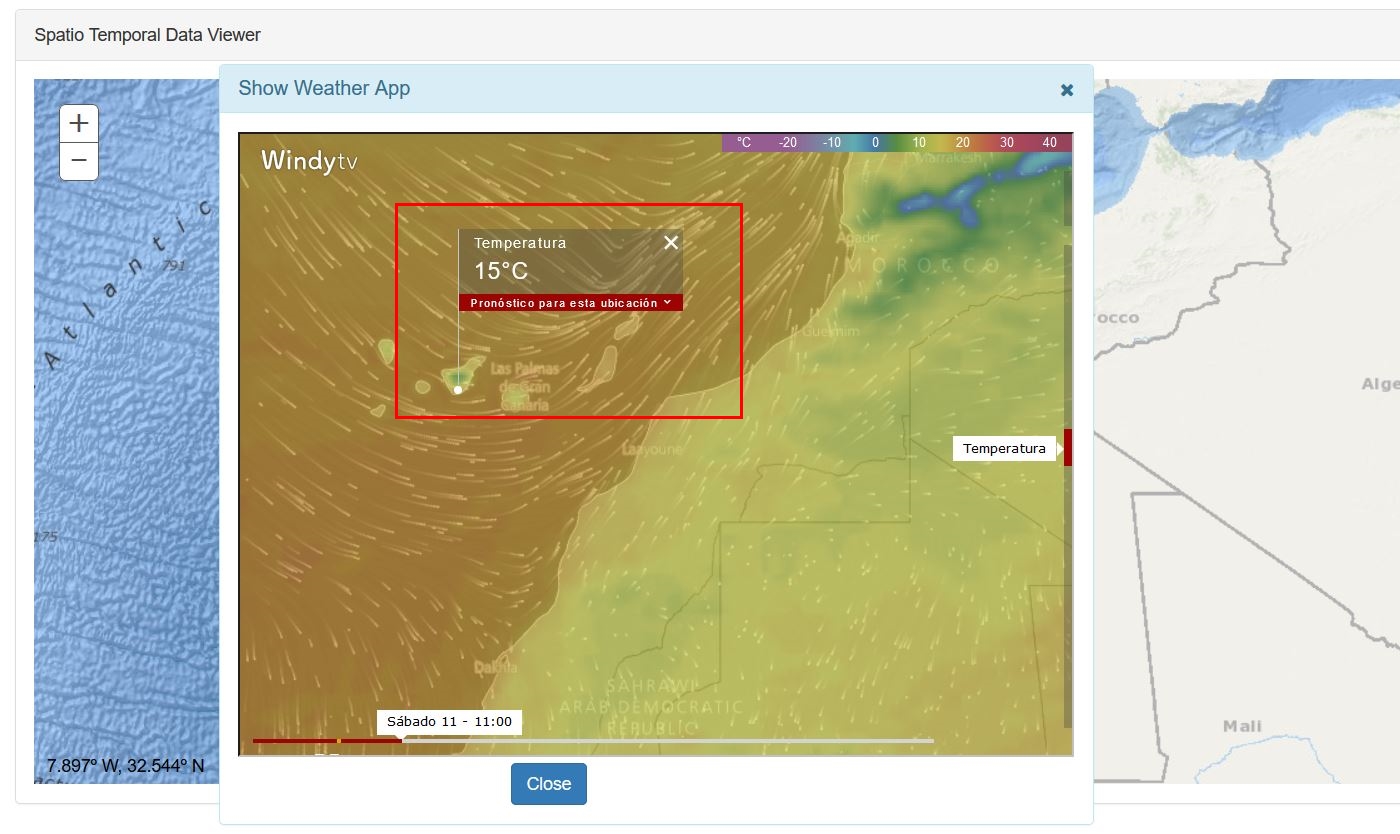
When the user clicks on the map a popup is shown with information about weather forecast for that location.
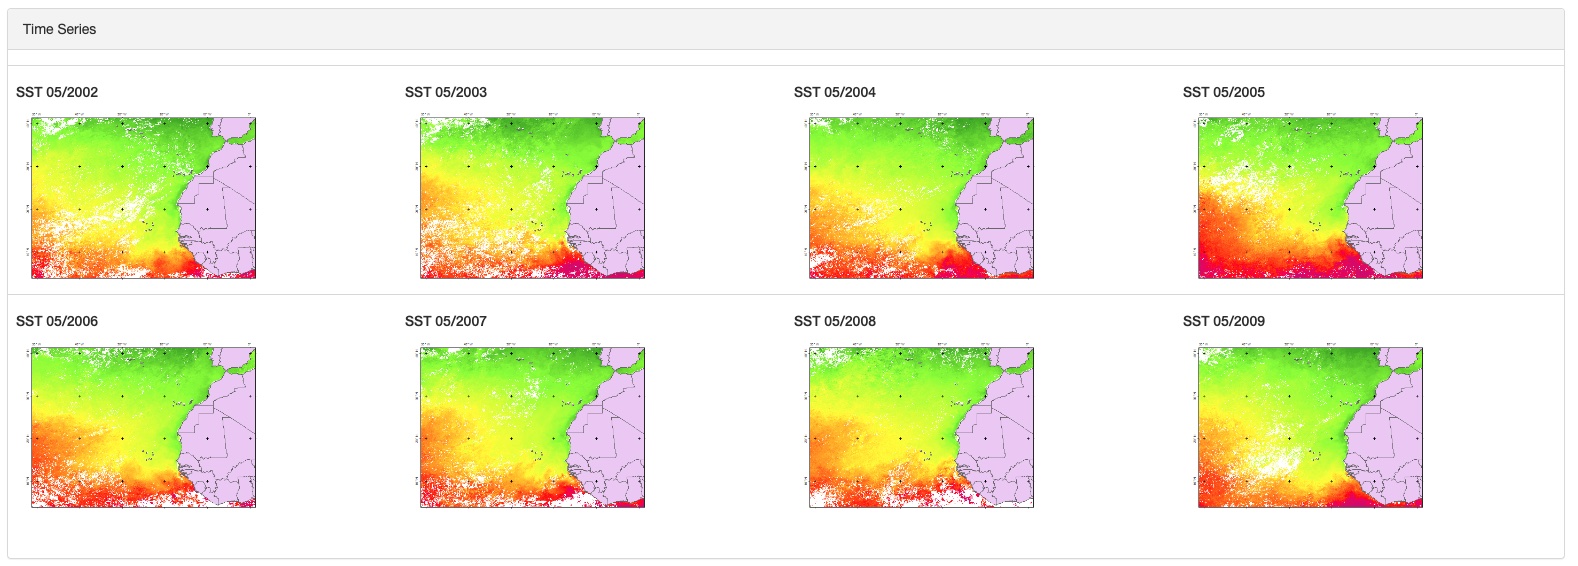
Click 'Monthly averaged SST and Chl-a' to access the 'Time Series' panel to select the Oceanographic Parameter,
Start & End Year and Month.
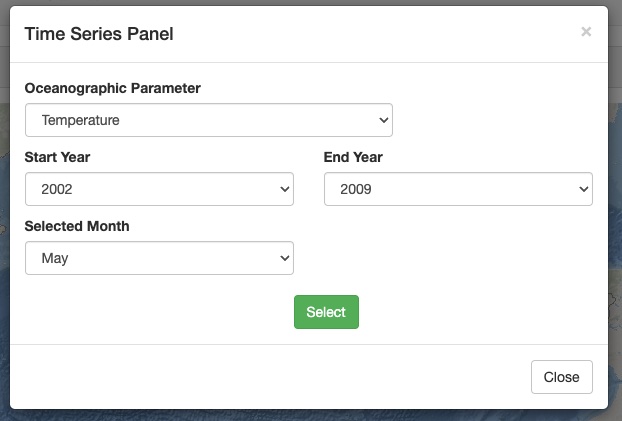
Series of Graphs are then displayed for the respective period.